Absentee rejection rate in Pennsylvania dropped from 1% in 2016 to 0.03% in 2020.
Absentee rejection rate in Georgia dropped from 3.5% in 2018 to 0.3% in 2020.
Categories
America is back

Categories
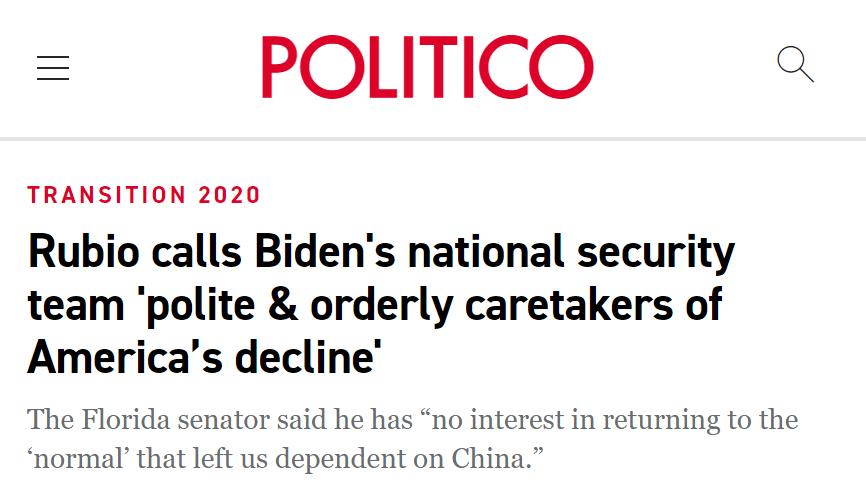
I like this new Rubio
Categories
Do it, privatize everything

Categories
Bitcoin passed $19,000


With Biden now appointing John Kerry as his climate czar, it’s worth remembering that under Obama, John Kerry was hoping to use ISIS to remove Assad from power. It didn’t work out that way.
“I mean, the reason Russia came in is because ISIL was getting stronger. Daesh was threatening the possibility of going to Damascus and so forth. And that’s why Russia came in. Because they didn’t want a Daesh government. And they supported Assad. And, and, uh, and we we know that this was growing. We were watching. We saw that, that Daesh was growing in strength. And we thought Assad was threatened. Uhh, we thought our, we could probably manage, uh, you know, that Assad might then negotiate. Instead of negotiating, you’ve got Assad and you’ve got Putin to support him.” – John Kerry
https://www.methylated.net/2017/01/14/i-mean-the-reason-russia-came-in-is-because/


John Kerry, Obama’s former Secretary of State and Biden’s new climate czar, was one of the advisors in the Obama administration who argued against more force against Assad in Syria, no doubt to achieve similar success as in Iraq and Libya.
Categories
Are we hoarding paper towels again?
Are we hoarding paper towels again?
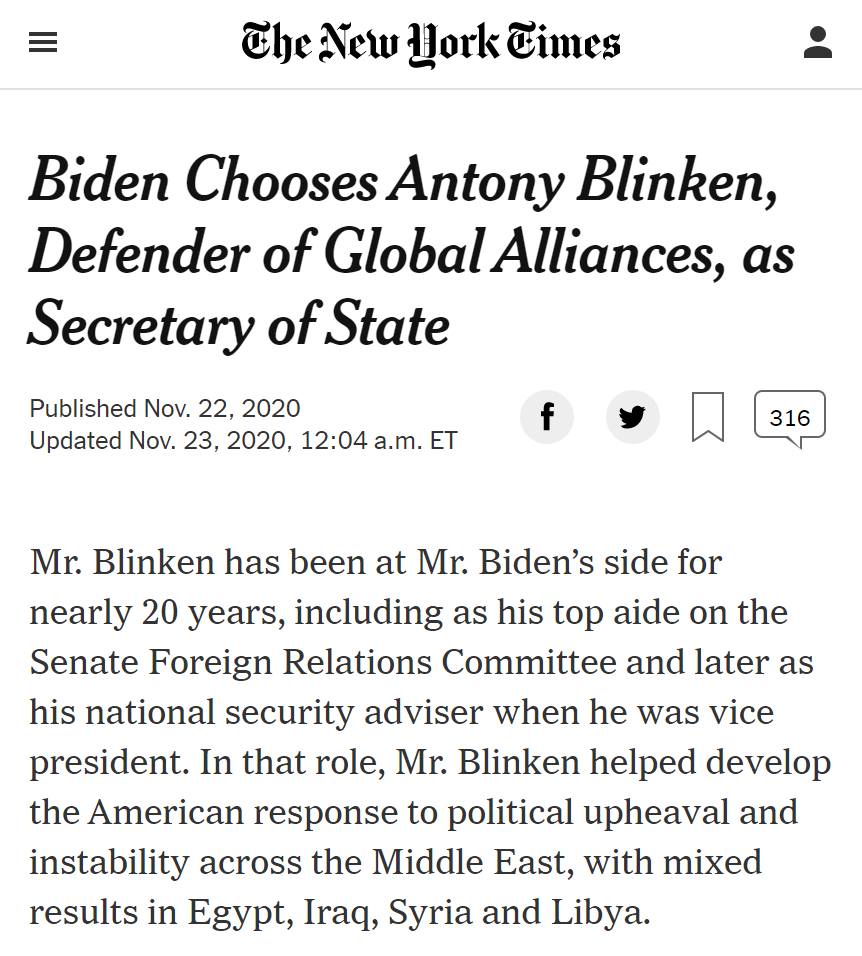
Mr. Blinken, Biden’s Secretary of State and Defender of Global Alliances, is best known for the fine work he did in Libya and Syria under the Obama administration wherein he helped turn one into an open-air slave market and the other into the largest refugee crisis in the world, or as the NY Times calls it, mixed results.
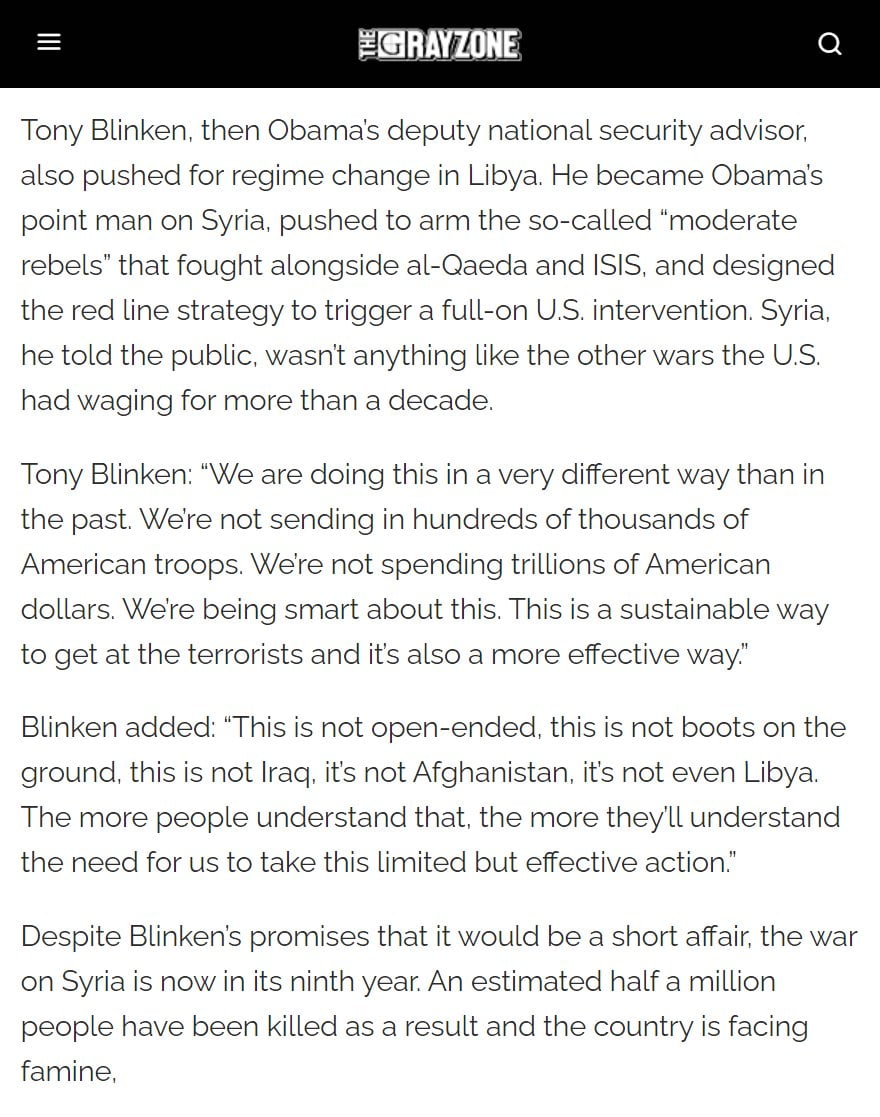
Blinken’s limited but effective action ended up less than effective.